Features TEMPLO® V2023


Features TEMPLO® V2022
TEMPLO®
+ Implementation of the tracked data from Theia3D directly in TEMPLO®
The 3D motion analysis workflow has been optimized to be fully automated after recording and the data are available in TEMPLO® for dashboard analysis and reporting after the tracking in Theia3D. With the new automated report pages, you can get 3D upper and lower limb kinematics in TEMPLO® within minutes.
> Read more
+ Optimisation of the calibration workflow of recordings with Theia3D
Use the new recording function for calibration recordings with Theia3D. These recordings are automatically recorded at a lower frame rate to save data volumes.
+ New angles for the 3D analysis
In addition to the previous angles, other angles have been integrated now, such as: Shoulder axis, upper body tilt, ankle joint, pelvic axis and heel strike angle. During video playback, the selected data and the gait and running phases defined by you in the timeline are displayed to you at the respective time.
+ New USB camera integration
By integrating the new 5 MP USB camera, the following video recording performance improvements can be achieved:
- Improvement of image quality
- Increase the light sensitivity
- Increasing the frame rate
- Increase in resolutions
- Increase mobility
- Possibility of integration into already existing network structures
+ Integration of new hardware for pressure distribution measurement
The latest SensorMedica Freemed™ plates in the sizes 40x40cm, 80x40cm, 60x50cm can be integrated into TEMPLO® for static and dynamic recording of pressure distribution synchronously with the video.
> Read more
+ Graphical representation of the ground reaction force [N] and the maximum pressure [N/cm2]
The ground reaction force [N] and the maximum pressure [N/cm2] determined via the pressure measurement can be displayed graphically as a data series in addition to the visual display in the dashboard.
– The graphical representation of the ground reaction force shows the sum of all acting forces measured at that moment on the pressure measuring plate.
– In combination with the graphical and visual representation of the maximum pressure, it is possible to determine where and at what time the sensors perceive the highest prevailing pressure.
> Read more
+ Setting the sensitivity for visual pressure display
The display of the force effect on the individual sensors to the unit N/cm2 can be manually adjusted to the customer target group (e.g. children, adults, etc.). Drag on the scale from the color intensity and amplitude to change the scale.
+ New filter functions for EMG raw signals
With the new filter function in the side panel, the raw EMG signals can be predefined or individually filtered to illustrate the muscle activity more clearly in the diagram. In addition, you can define your own filters individually and save them for further analyses. The following filters can be selected and combined freely:
- Offset correction
- Lowpass filter
- Highpass filter
- Rectify
- Lowpass filter
Simultaneous display of differently filtered raw data is possible, which allows comparison between the filters.
> Read more
+ Optimisation of the Delsys – EMG integration
The use of the Delsys EMG in TEMPLO® has been optimised by, among other things, speeding up the initialisation time by about 30%.
Additional EMG sensors can be easily added during an analysis between recordings and TEMPLO® recognises them automatically.
> Read more
+ Share analysis datasets on USB stick
Instead of the TEMPLO® Player CD, USB sticks can now be stored with the TEMPLO® Player and the respective analysis via the software and thus be made available to the customer. Several tests can be selected and added.
+ MP4 compression through new codec for video export
A new codec has been integrated into TEMPLO® that exports the video files as MP4 files. By compressing the data of the video files, the videos can be easily shared via mobile phones/tablets or in video portals. This reduces the transmission time.
+ Software optimisation
The performance of the TEMPLO® software could be sustainably improved by a decisive optimisation and release of the RAM. Benefit now from a more powerful new version!
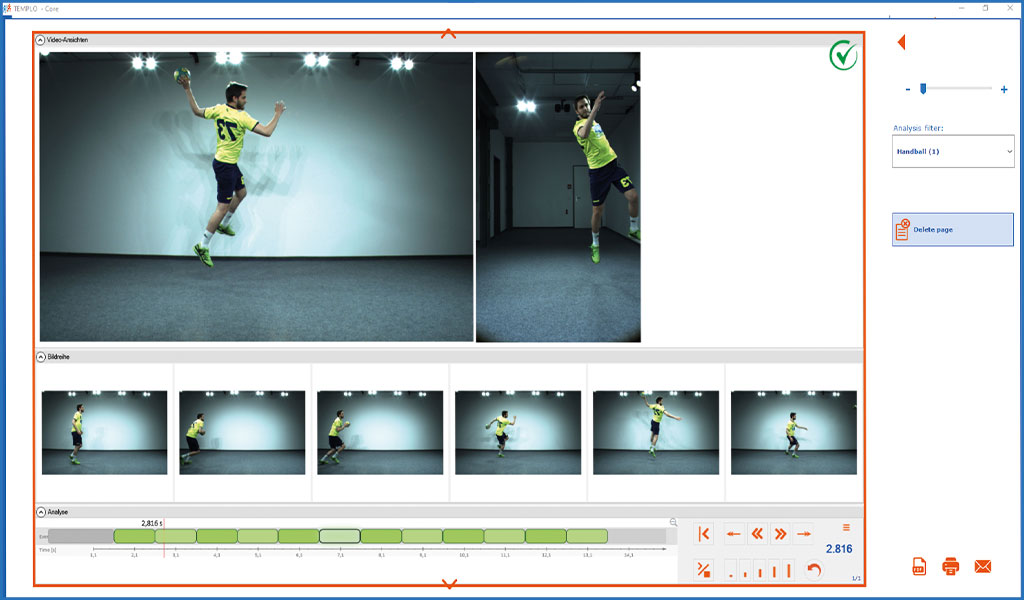
New Analysis scheme TEMPLO® Core
+ Neues Design
The user interface shines with new control and information elements. These guide you intuitively through the software and support you from the recording to the feedback discussion with your customer/athlete.
+ Dashboard Analysis
– Dashboard Editor
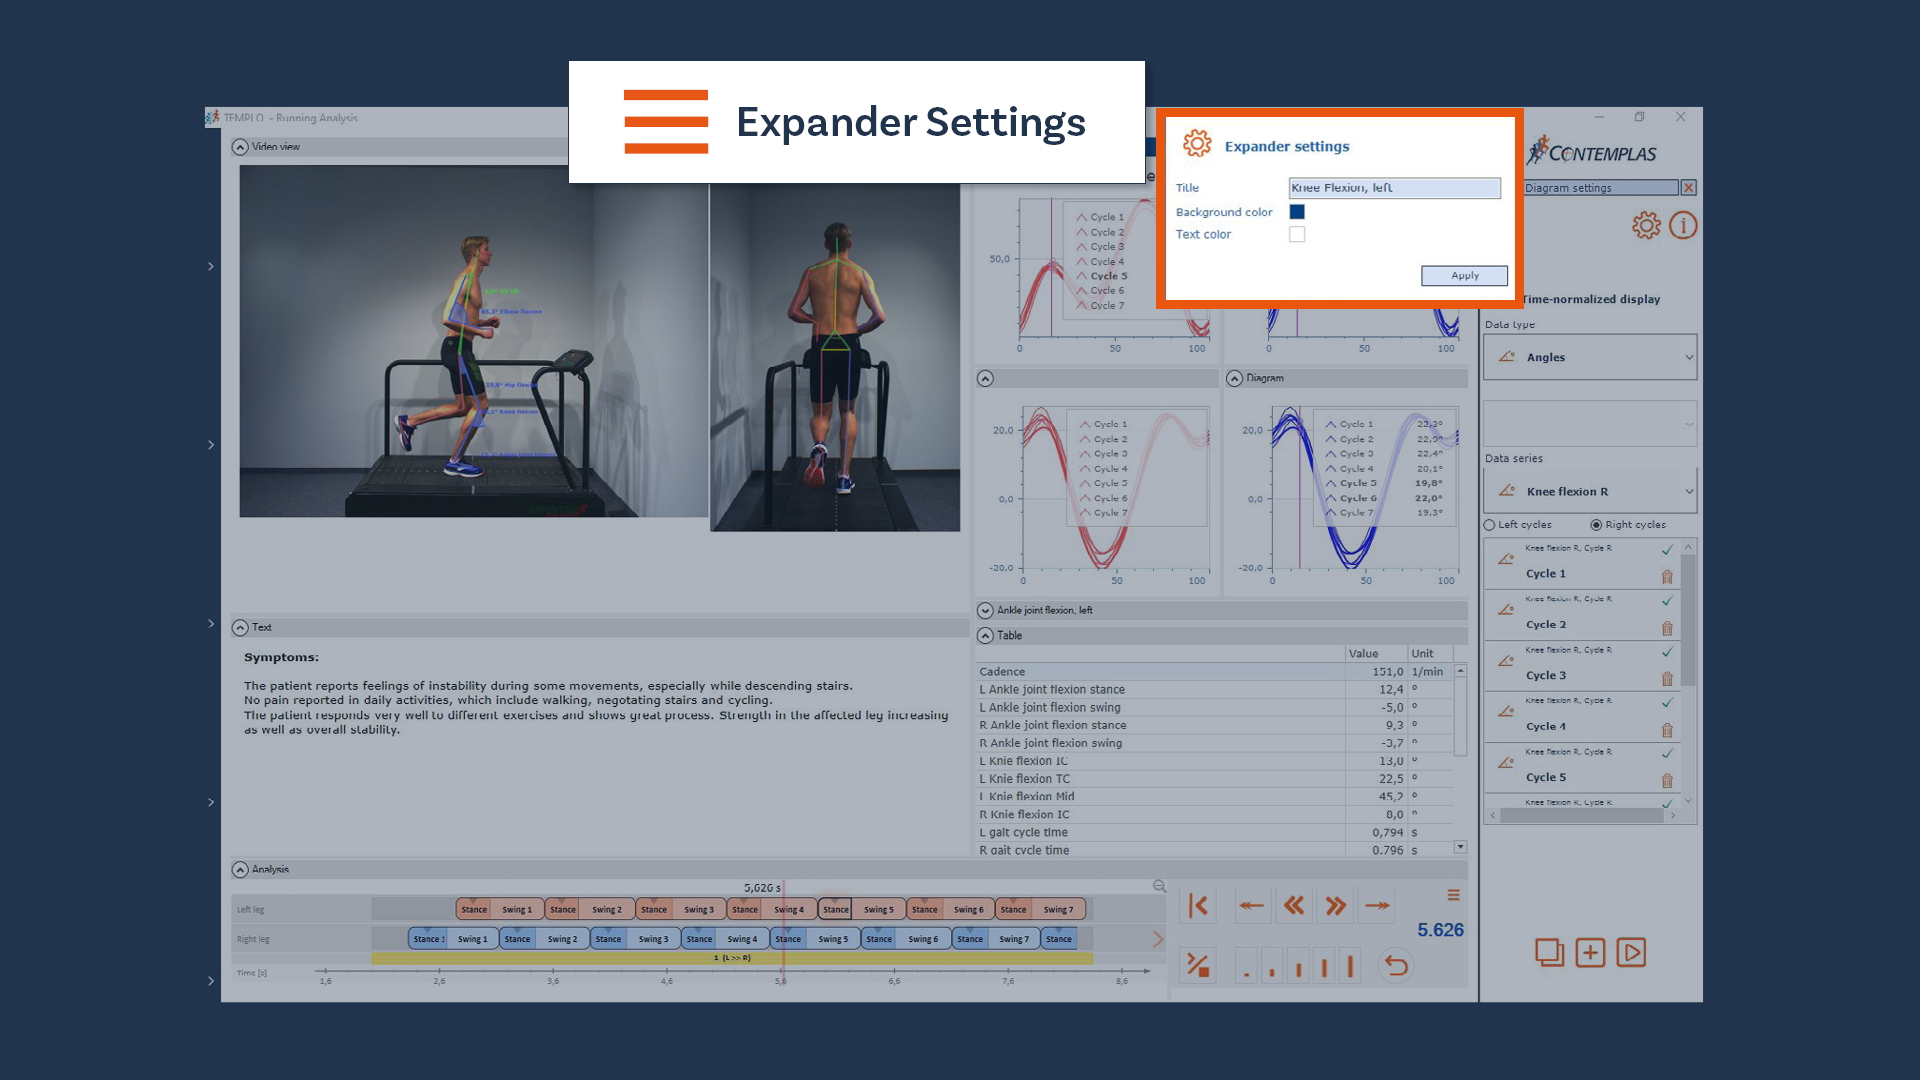
TEMPLO® Core offers various display options for your analysis results. Get inspired by our new templates or create your own template with the new Dashboard Editor, tailored to your workflow. So that you receive your relevant data in a target-oriented and faster way.
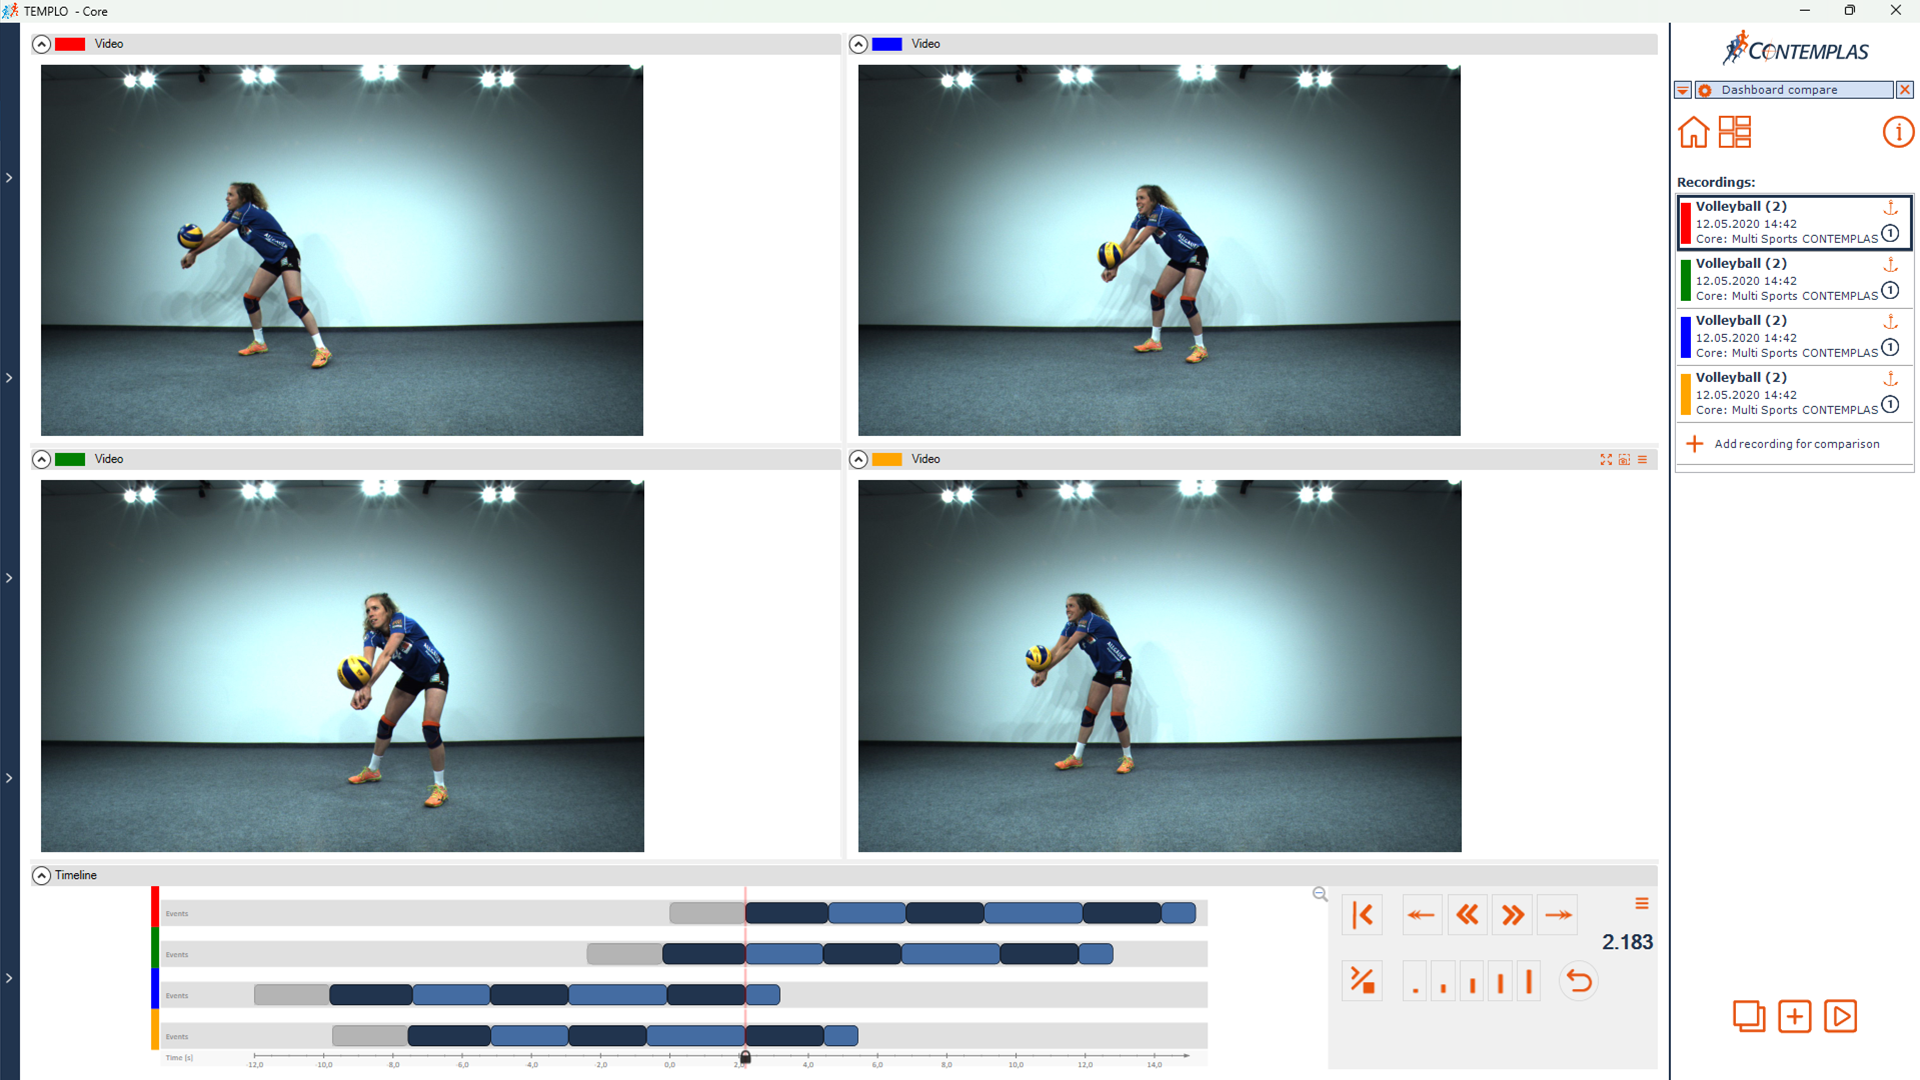
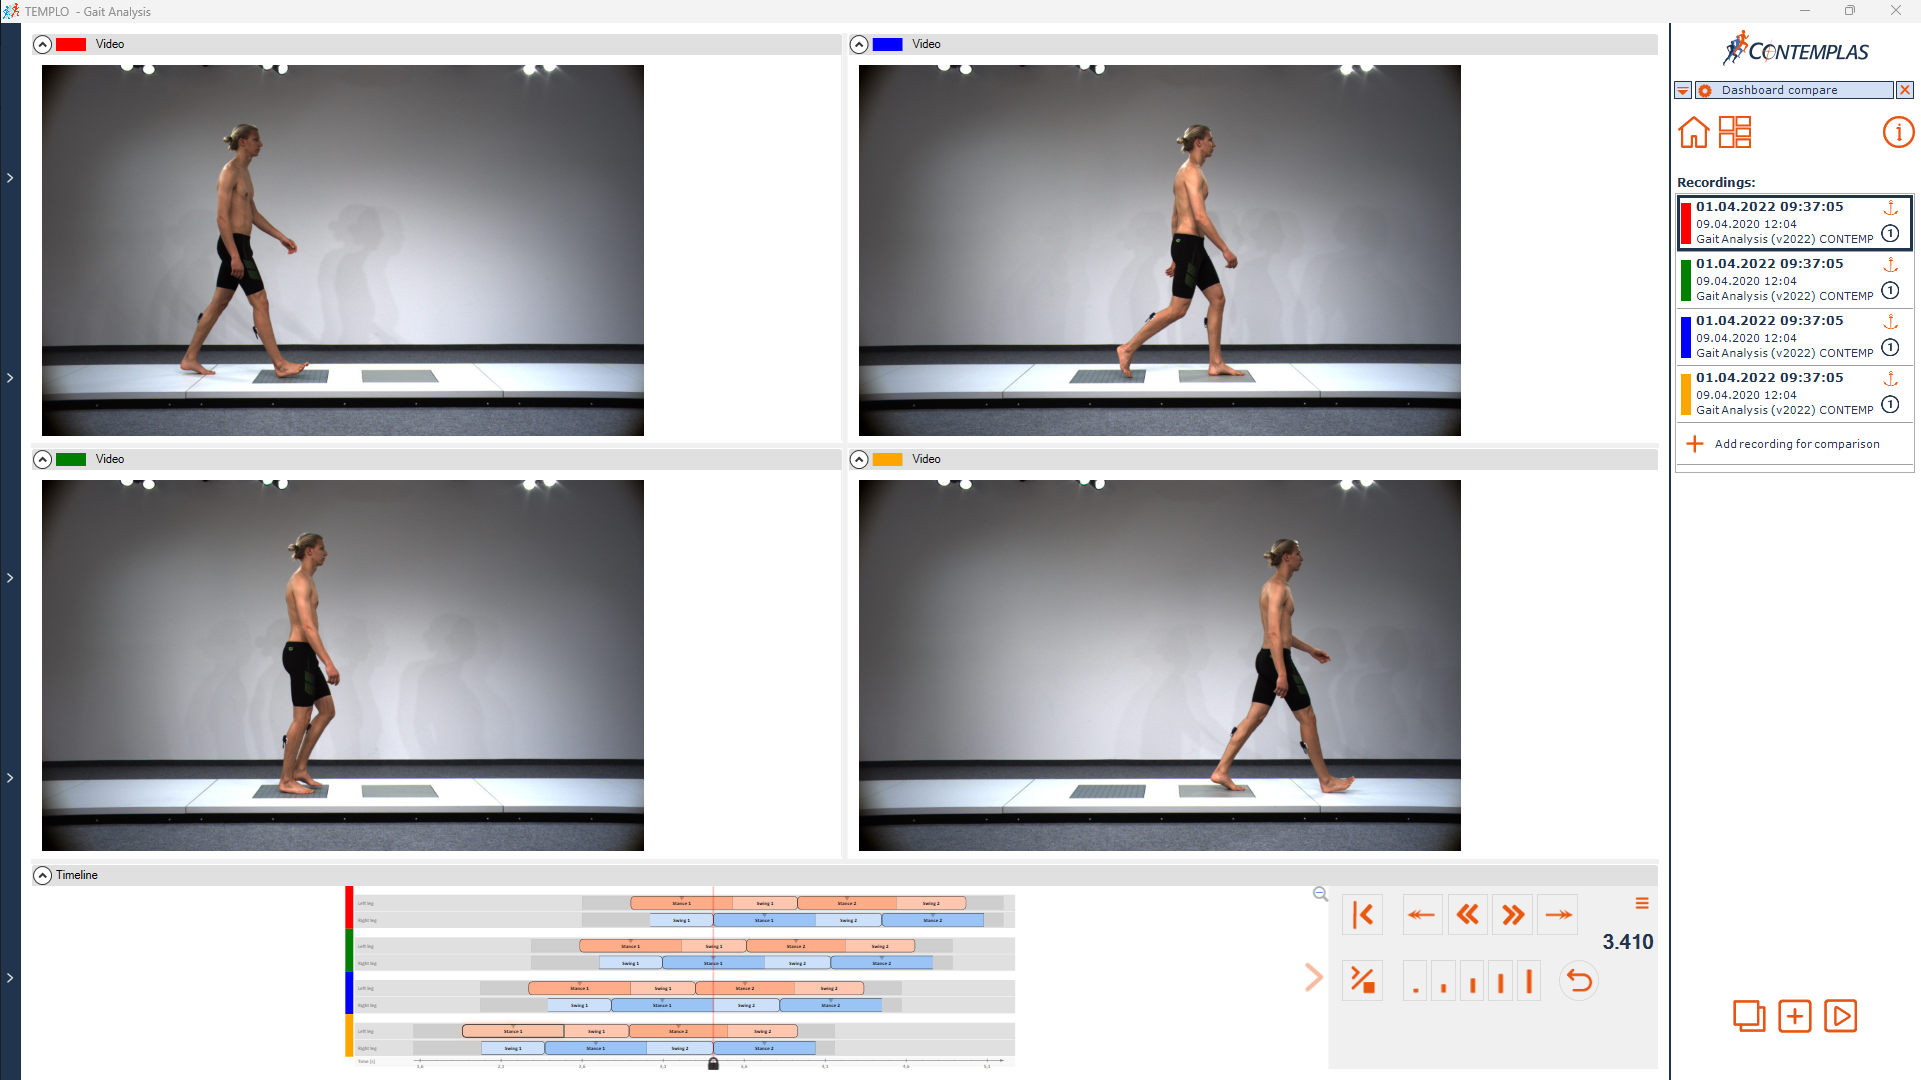
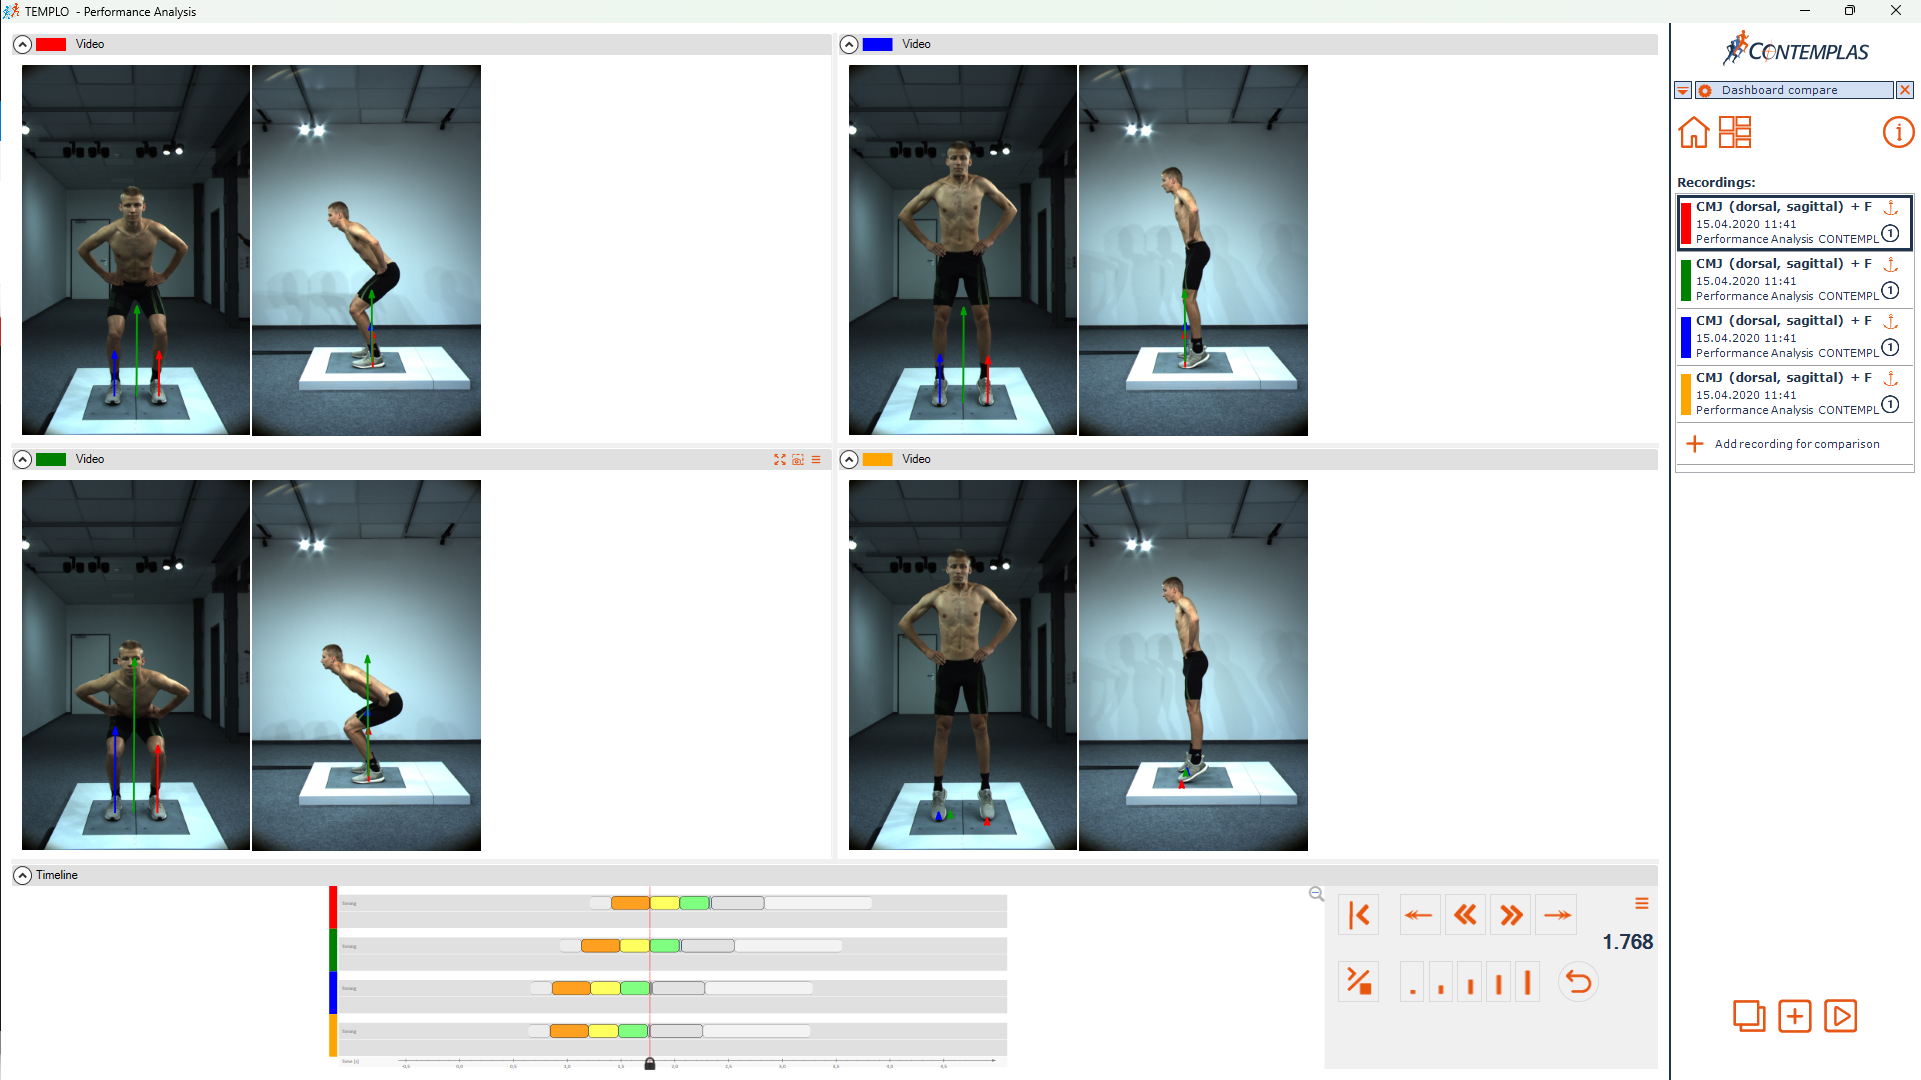
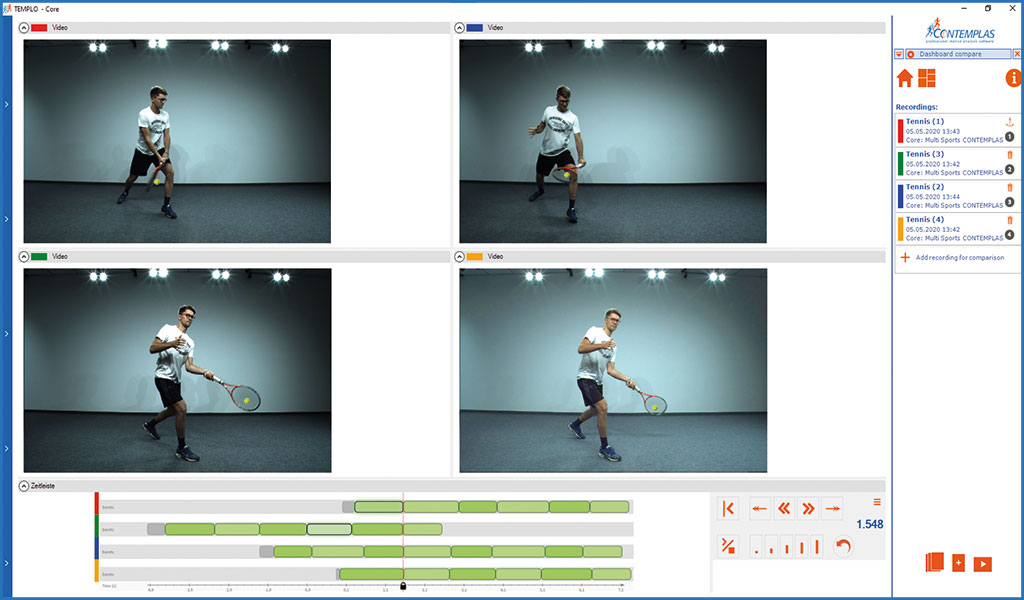
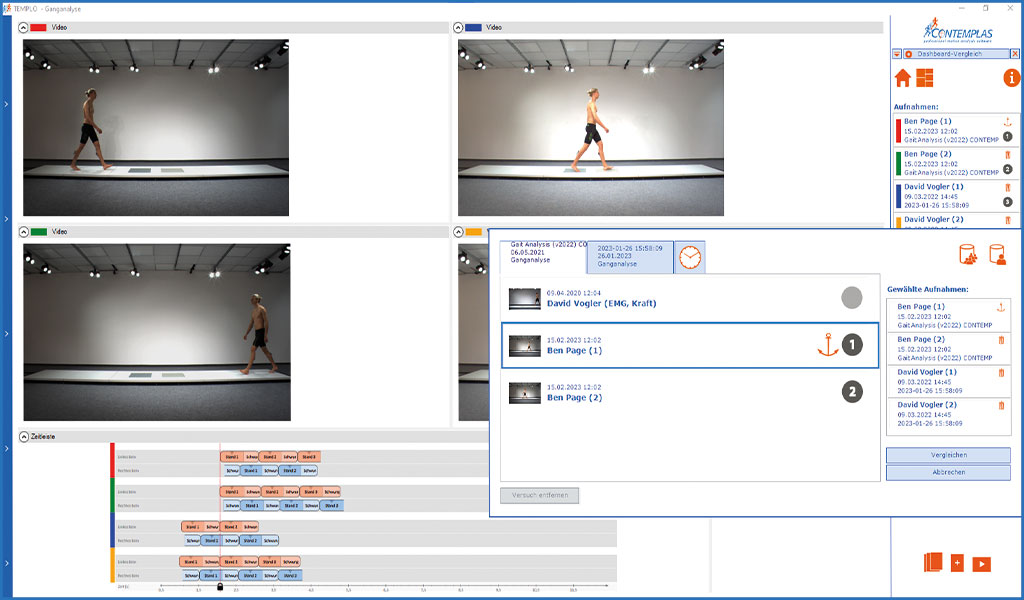
+ Comparison of up to 4 recordings of one person
Recordings within one session can be selected quickly and easily from the available recordings and displayed in comparison. It is possible to select up to 4 recordings of one person. The intelligent timeline in the analysis dashboard automatically synchronizes the videos to a predefined time. Alternatively, the synchronization times of the videos can be defined or adjusted manually.
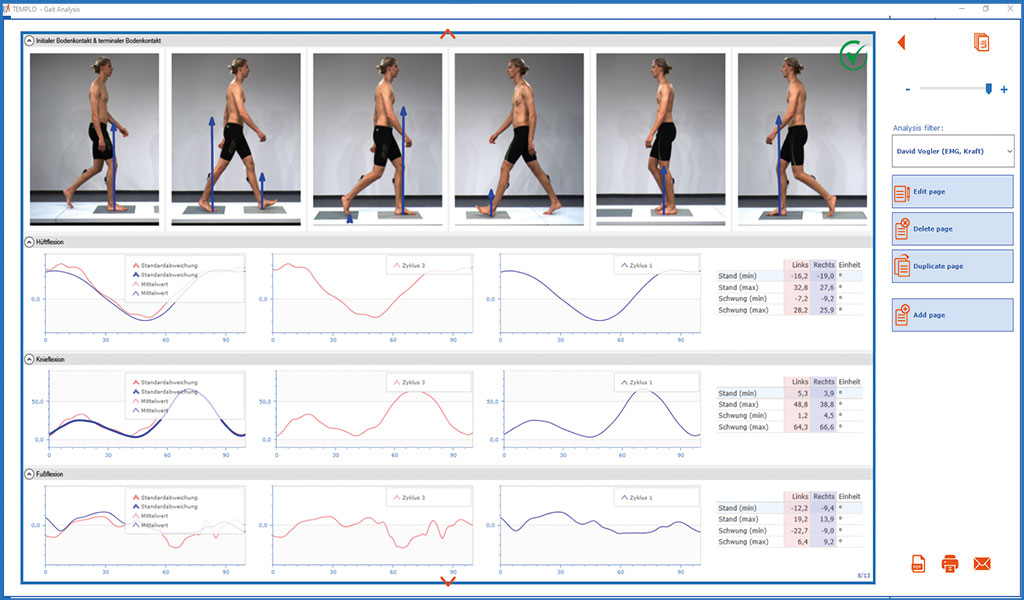
New functions for TEMPLO® Gait Analysis
+ Optimization of the 2D tracking technology
With the new version’s significant performance increase in 2D markerless tracking, you can access your data in just one-third of the time previously required.
After markerless tracking is complete, the stick figure is automatically overlaid on the video image to indicate that the data is available for further analysis. The body points facing away from the camera (upper arm, forearm and hand) are no longer displayed with dashes overlaid in the video, but are still tracked.
+ Dashboard Analysis
– Dashboard Editor
New predefined analysis dashboards are available in Gait Analysis. Choose from several templates or create your own template tailored to your workflow using the new Dashboard Editor.
Use the new text field to add notes, comments or findings to the analysis. In this way you can create a clear analysis report for your clients.
+ Automatic determination of events based on Optogait data
The individual events (Initial Contact & Terminal Contact) can be read out from the recorded Optogait data. After an event has been defined, the remaining times are set automatically based on the Optogait evaluation. In addition to the automatically detected events, you can manually add or change other gait events before or after in the timeline to complete the step determination.
+ Time normalised analysis data
The analysis parameters of the gait analysis can now be displayed as time-normalized data over the gait cycle. Decide individually for each parameter how it should be displayed in your analysis dashboard: time-based progression over the entire analysis period or time-normalized display of single cycles, mean values and standard deviations.
+ Right/left comparison of data within an analysis
The automatic person and gait direction detection captures the change of gait direction during recording:
- Data are recorded from the right and left sides of the body.
- The recording is automatically cropped to the recording area that is to be analysed for tracking.
- In the dashboard analysis, events can be set for all relevant points in time of the gait phases.
- All set events are displayed on a timeline regardless of the direction of movement.
- In the report, all analysis data from the right and left side of the body are available and can be compared with each other
> Watch new functions in video
+ Report
Based on the defined gait phases in the timeline, you can add image series to your report. You can also decide which graphical elements (e.g. angles, motion paths, points, labels) should be displayed overlaid in the image series.
+ Automatically generated report collection
Benefit from our new “automatic report function” and have report pages created automatically directly after the analysis.
With the report function you have the following options:
- Choose from various predefined report pages. You can customise them according to your needs and save them individually as templates. You can also create and save entire report collections.
- Add quick report pages to the automatic report. The current view of the dashboard can be added to the PDF report collection with one click. Notes and comments can be added to each page.
- Use the new text field in the dashboard to add notes and comments to the analysis.
- Save text templates in the report collection. These texts can be used for all analyses, i.e. individual text modules can be picked out and selected for the relevant analysis.
- Display individual images from the analysis video in the report. Based on the defined gait phases in the timeline, you can have images displayed next to each other as a series of images at the respective point in time.
- Add external images to the report, e.g. graphics from the Zebris report or even logos.
- To share the report with others, you can print it out or send it by e-mail.
> Watch new functions in video
+ Data export via dashboard
– Export time-normalized & time-based analysis data
Export displayed analysis data directly from your analysis dashboard. A drop-down menu allows you to choose between time-based & single time-normalized analysis data. For time-based data, all chart data is exported, while for time-normalized data you have the option to export individual cycles, standard deviations and mean values.
Export the analysis data directly from the dashboard view. Via a drop-down menu you have the possibility to select different data individually, which should be exported. The data can be exported to Excel, for example.
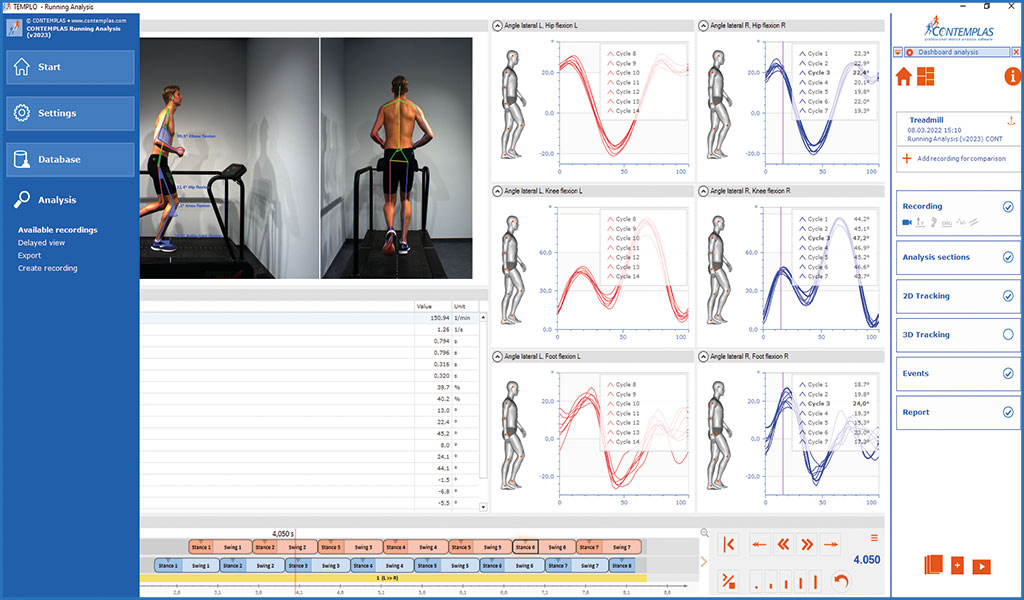
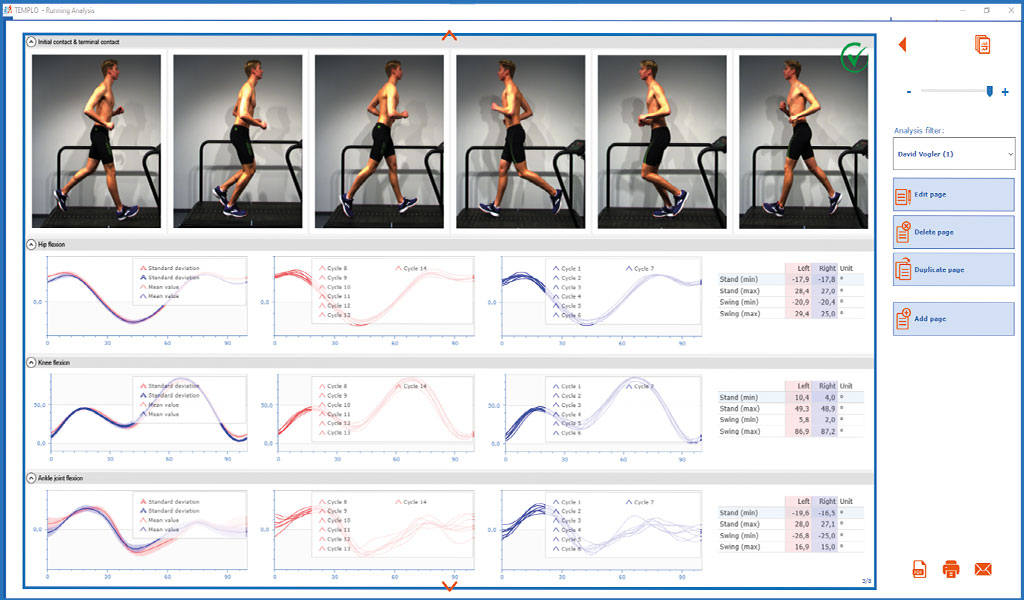
New functions for TEMPLO® Running Analysis
+ Optimization of the 2D tracking technology
With the new version’s significant performance increase in 2D markerless tracking, you can access your data in just one-third of the time previously required.
After markerless tracking is complete, the stick figure is automatically overlaid on the video image to indicate that the data is available for further analysis. The body points facing away from the camera (upper arm, forearm and hand) are no longer displayed with dashes overlaid in the video, but are still tracked.
+ Dashboard Analysis
– Dashboard Editor
New predefined analysis dashboards are available in Running Analysis. Choose from several templates or create your own template tailored to your workflow using the new Dashboard Editor.
Use the new text field to add notes, comments or findings to the analysis. In this way you can create a clear analysis report for your clients.
+ Automatic determination of events based on Optogait data
The individual events (Initial Contact & Terminal Contact) can be read out from the recorded Optogait data. After an event has been defined, the remaining times are set automatically based on the Optogait evaluation. In addition to the automatically detected events, you can manually add or change other running events before or after in the timeline to complete the step determination.
+ Time normalised analysis data
The analysis parameters of the running analysis can now be displayed as time-normalized data over the running cycle. Decide individually for each parameter how it should be displayed in your analysis dashboard: time-based progression over the entire analysis period or time-normalized display of single cycles, mean values and standard deviations.
+ Right/left comparison of data within an analysis
The automatic person and running direction detection can identify the change of running direction (e.g. treadmill reverse) during recording:
- Data are recorded from the right and left sides of the body.
- The recording is automatically cropped to the recording area that is to be analysed for tracking.
- In the dashboard analysis, events can be set for all relevant points in time of the run phases.
- All set events are displayed on a timeline regardless of the direction of movement.
- In the report, all analysis data from the right and left side of the body are available and can be compared with each other.
> Watch new functions in video
+ Report
Based on the defined running phases in the timeline, you can add image series to your report. You can also decide which graphical elements (e.g. angles, motion paths, points, labels) should be displayed overlaid in the image series.
+ Automatically generated report collection
Benefit from our new “automatic report function” and have report pages created automatically directly after the analysis.
With the report function you have the following options:
- Choose from various predefined report pages. You can customise them according to your needs and save them individually as templates. You can also create and save entire report collections.
- Add quick report pages to the automatic report. The current view of the dashboard can be added to the PDF report collection with one click. Notes and comments can be added to each page.
- Use the new text field in the dashboard to add notes and comments to the analysis.
- Save text templates in the report collection. These texts can be used for all analyses, i.e. individual text modules can be picked out and selected for the relevant analysis.
- Display individual images from the analysis video in the report. Based on the defined running phases in the timeline, you can have images displayed next to each other as a series of images at the respective point in time.
- Add external images to the report, e.g. graphics from the Zebris report or even logos.
- To share the report with others, you can print it out or send it by e-mail.
> Watch new functions in video
+ Data export via Dashboard
– Export time-normalized & time-based analysis data
Export displayed analysis data directly from your analysis dashboard. A drop-down menu allows you to choose between time-based & single time-normalized analysis data. For time-based data, all chart data is exported, while for time-normalized data you have the option to export individual cycles, standard deviations and mean values.
Export the analysis data directly from the dashboard view. Via a drop-down menu you have the possibility to select different data individually, which should be exported. The data can be exported to Excel, for example.
New functions for TEMPLO® Retail Running Analysis
+ Automated detection of IC/TC and right/left based on pressure contacts
Due to the pressure distribution measurement, initial & terminal contact as well as right & left leg are automatically detected and assigned to the respective events in the timeline. In addition to the automatically detected events, you can manually add further events before or after in the timeline to complete the step determination.
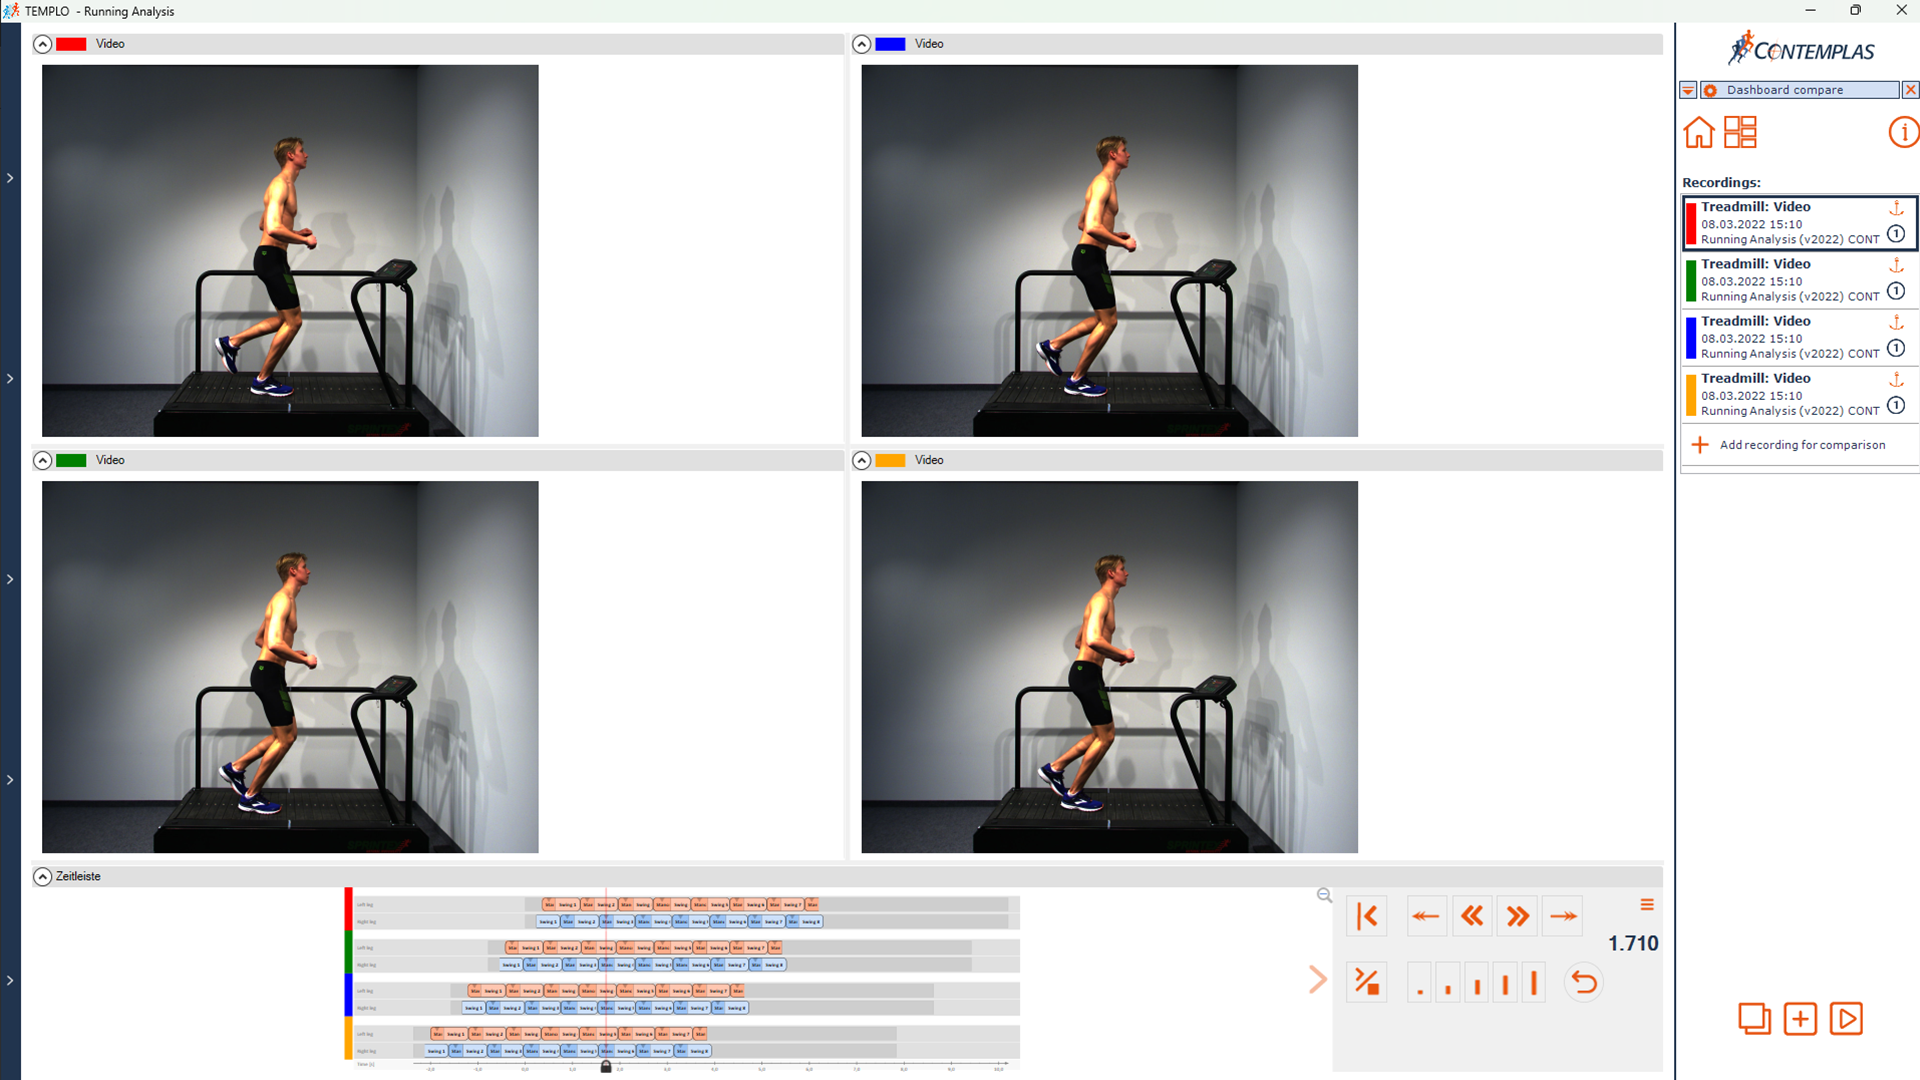
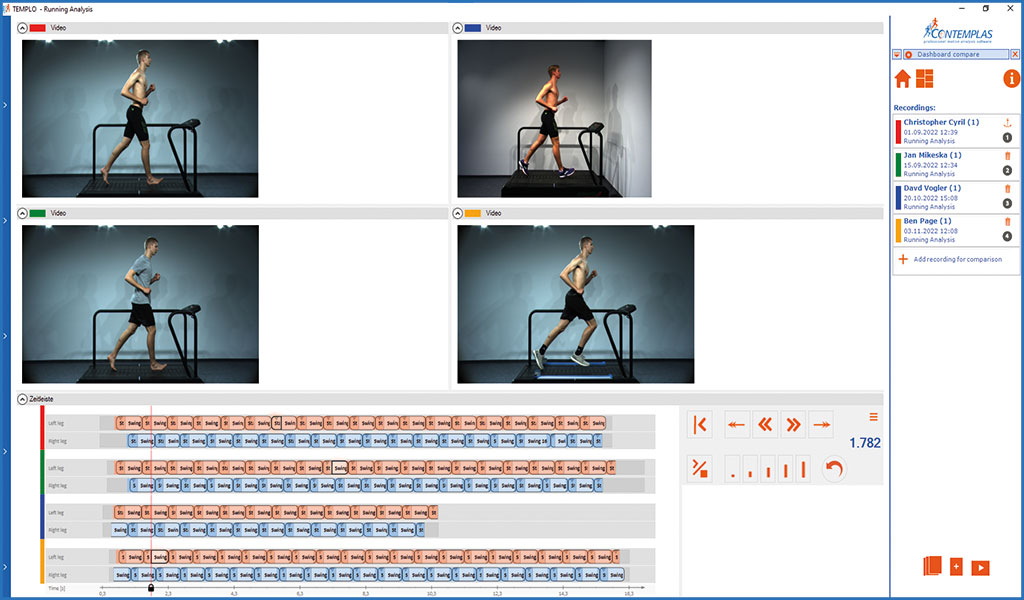
+ Comparison of up to 4 data sets of one person
Different recordings of one customer can be compared with each other in the dashboard for shoe comparison. Select up to 4 recordings quickly and easily via the menu item “available recordings”.
New functions for TEMPLO® Performance Analysis
+ Beta version: New analysis design on demand
A new analysis design for TEMPLO® Performance Analysis with markerless tracking is now available on request. Benefit from:
- Predefined analysis templates with more individual analysis scope
- Display of prioritised parameters for quick feedback
- 2D markerless tracking
New functions for TEMPLO® Swimming Analysis
+ Export of personal data from start and turn analysis
Display the analysis parameters from the start and turn analysis in relation to personal data in the results table. This results table can be exported for further external data processing.
Features TEMPLO® V2021
TEMPLO®
+ 3D Analysis in TEMPLO® with Theia3D
Extend your analyses from 2D to 3D. With Markerless 3D, TEMPLO® allows a straightforward, yet detailed analysis of various movements. Free from the limitations of traditional systems, you can capture your athletes on the field or customers in different premises.
Record – Track – Analyse: Record videos quickly and easily in TEMPLO®. Save valuable time through markerless analysis: no markers, no special clothing, simple setup. The automatic tracking in Theia3D processes the data with a single mouse click. Use the results for extensive, automatic reports in Visual3D, which you can tailor to your individual preference.
Read more
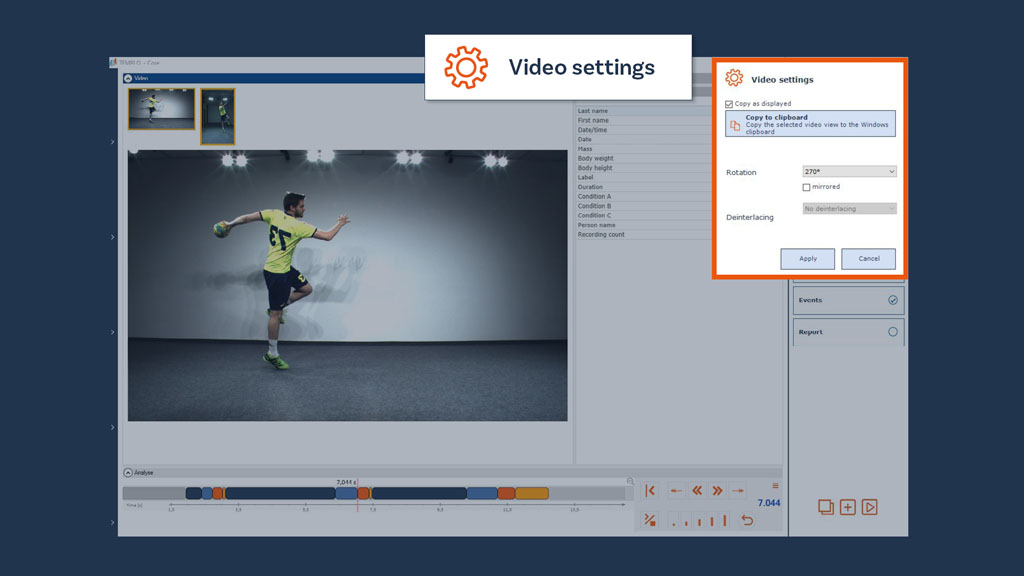
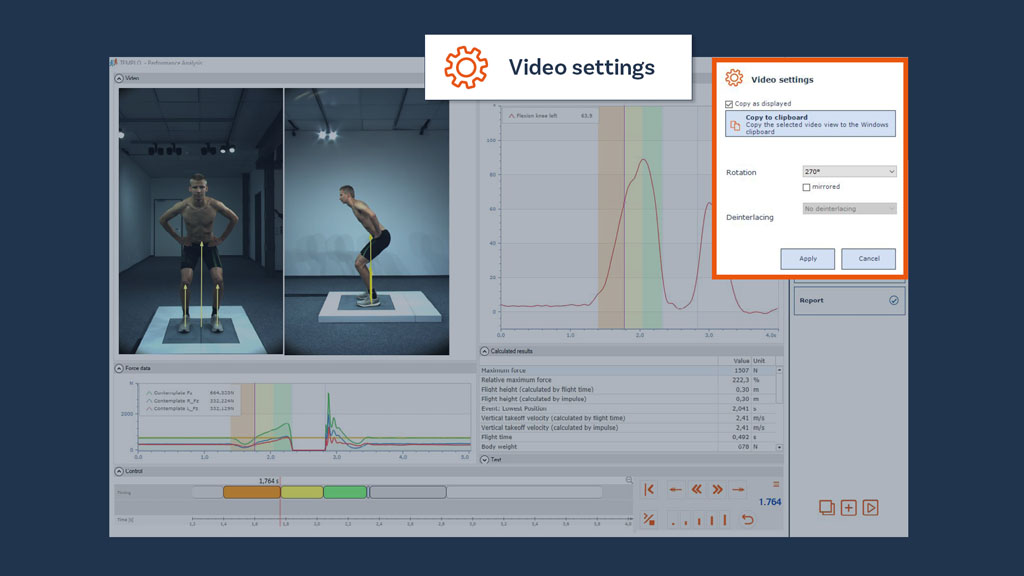
+ Integration of new camera models
Network and USB – cameras: The integration of new models can achieve the following performance improvements in video recording:
– Improvement in image quality
– Increase in light sensitivity
– Increase in frame rates
– Increase in resolutions
– Increase in mobility
– Integration into existing network structures possible
– Increased mobility through recording with HDV cameras via notebook connection
HDV cameras: By integration via notebook connection the mobility can be increased.
GoPro: With the use of an HDMI cable or a WLAN connection, the GoPro can be controlled and recorded via TEMPLO® so that the recordings are directly available for analysis.
+ Buzzer to start recording
The additional integration of a buzzer allows you to start the video recording in TEMPLO® parallel to a PC. Place the mobile buzzer independently of your measuring station and set the duration of the recording period individually. This way, live and subsequent recordings can be made and a self-analysis can also be started.
Read more
+ Tablet
– Tablet analysis:
Tablets with a WLAN connection can be used parallel with a PC and allows simultaneous playback of TEMPLO® on several screens.
– Tablet control:
The tablet can also be used as a control element, e.g. to start and stop a video recording or to select different video recordings.
Read more
+ Software optimisation
– The analysis process has been speeded up through several performance improvements and increased playback stability. Optimisations have minimised the latency of live and delayed recordings.
– TEMPLO® supports the ability to integrate the latest and more powerful graphics cards.
+ Optimisation of the pressure distribution
The interface to the Zebris pressure distribution systems has been revised and expanded. The pressure distribution can thus be applied in several areas and enables additional data to be generated.
– Clinical Gait Analysis:
The pressure distribution measurement has been extended so that two single pressure distribution plates can now be used as an extended gait section measurement. By merging them, you can record a pressure measurement over the entire gait distance and capture multiple gait cycles.
– Running Analysis:
By integrating the pressure distribution measurement on the treadmill, a complete Zebris report with subdivided pressure data can be automatically saved as a PDF after recording video and pressure data in TEMPLO®.
New functions for TEMPLO® Gait Analysis
+ Infocenter
In the gait analysis you have a new overview page of all analyses of a selected person through the infocenter. The entries are provided with a picture and show important information, such as remarks and results, at a glance.
+ Markerless Tracking
Record (track) movements in clinical gait analysis completely without markers (markerless). The joint centers and body segments are automatically recognized and tracked. The tracking coordinates are available for each body point. In the video image, the movement patterns of individual body points as well as angle curves can be dynamically displayed and tracked over the entire video length. You can also display stick figures overlaid on the video image. Markerless tracking automatically detects the directions of movement (left-right/right-left, dorsal, ventral).
Working markerless offers the following advantages:
– Increase reliability
– Save analysis time through automated tracking
– Increase in objectivity
+ Dashboard recording
Start your recordings quickly and easily with our predefined user interface (dashboard). You can also create several personal user interfaces according to your individual requirements and save them as templates. Select the data to be recorded, such as video, analog data, pressure data and EMG. These data are displayed live during the recording.
+ Dashboard analysis
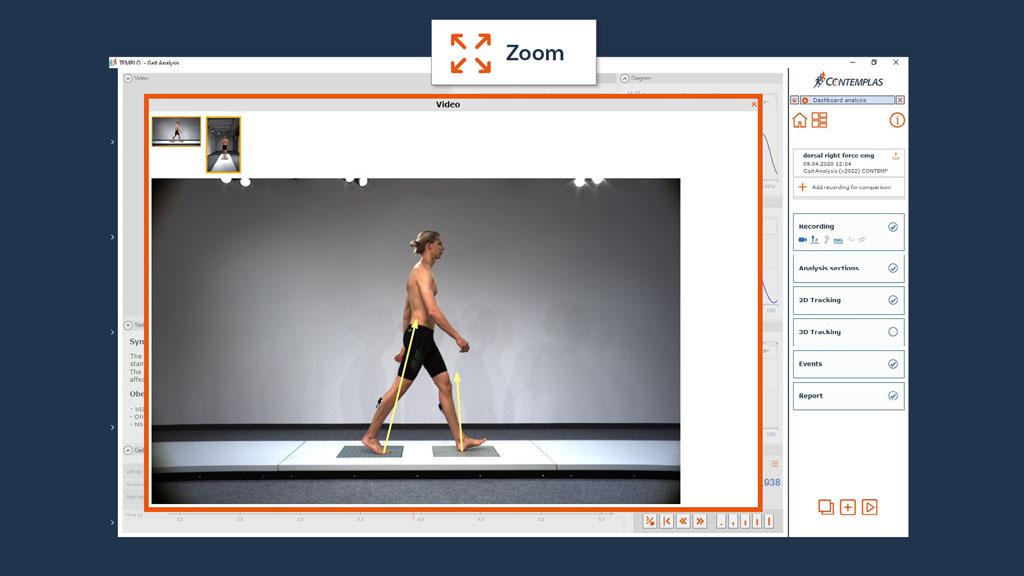
Predefined analysis templates (dashboard) in TEMPLO® allows you to evaluate a recording quickly and easily. The recorded and generated data is automatically displayed. You can also design your own results according to your needs and save them as a template. Display angle and motion path, analog and pressure data and many other data. In addition to the previous angles, other angles have been integrated now, such as: shoulder axis, upper body tilt, ankle joint, pelvis axis and foot axis. During video playback, the selected data and the gait cycles defined by you in the time line are displayed at the respective time.
Read more
+ Report
With the report function you can individually choose between 3 types of reports. The analysis data entered in the video is retained during export.
– Quick report: The current view of the dashboard can be added to the PDF report collection with one click. Notes and comments can be added to each page.
– Dashboard video export: The analysis is output as a video in the customised dashboard view.
– Video export: The analysis video views are exported to a video.
+ Image enhancement in live image
By integrating various image correction algorithms in TEMPLO®, the following correction measures can be carried out in the live image:
– Brightness correction
– Gamma correction
– Colour normalisation
– Contrast stretching
The parameters set in the camera combination are adopted when the videos are played back. Subsequent (repeated) application of the colour filters is also possible.
+ Optimisation of the pressure distribution
The pressure distribution measurement has been extended so that two single pressure distribution plates can now be used as an extended gait section measurement. By merging them, you can record a pressure measurement over the entire gait distance and capture multiple gait cycles.
+ Display of the force vectors
Display the direction and strength of the ground reaction forces by graphically overlaying the force vector in live view, analysis view and in the video report.
New functions for TEMPLO® Running Analysis
+ Markerless Tracking
Record (track) movements in running analysis completely without markers (markerless). The joint centers and body segments are automatically recognized and tracked. The tracking coordinates are available for each body point. In the video image, the movement patterns of individual body points as well as angle curves can be dynamically displayed and tracked over the entire video length. You can also display stick figures overlaid on the video image. Markerless tracking automatically detects the directions of movement (left-right/right-left, dorsal, ventral).
Working markerless offers the following advantages:
– Increase reliability
– Save analysis time through automated tracking
– Increase in objectivity
+ Dashboard recording
Start your recordings quickly and easily with our predefined user interface (dashboard). You can also create several personal user interfaces according to your individual requirements and save them as templates. Select the data to be recorded, such as video, analog data, pressure data and EMG. These data are displayed live during the recording.
+ Dashboard analysis
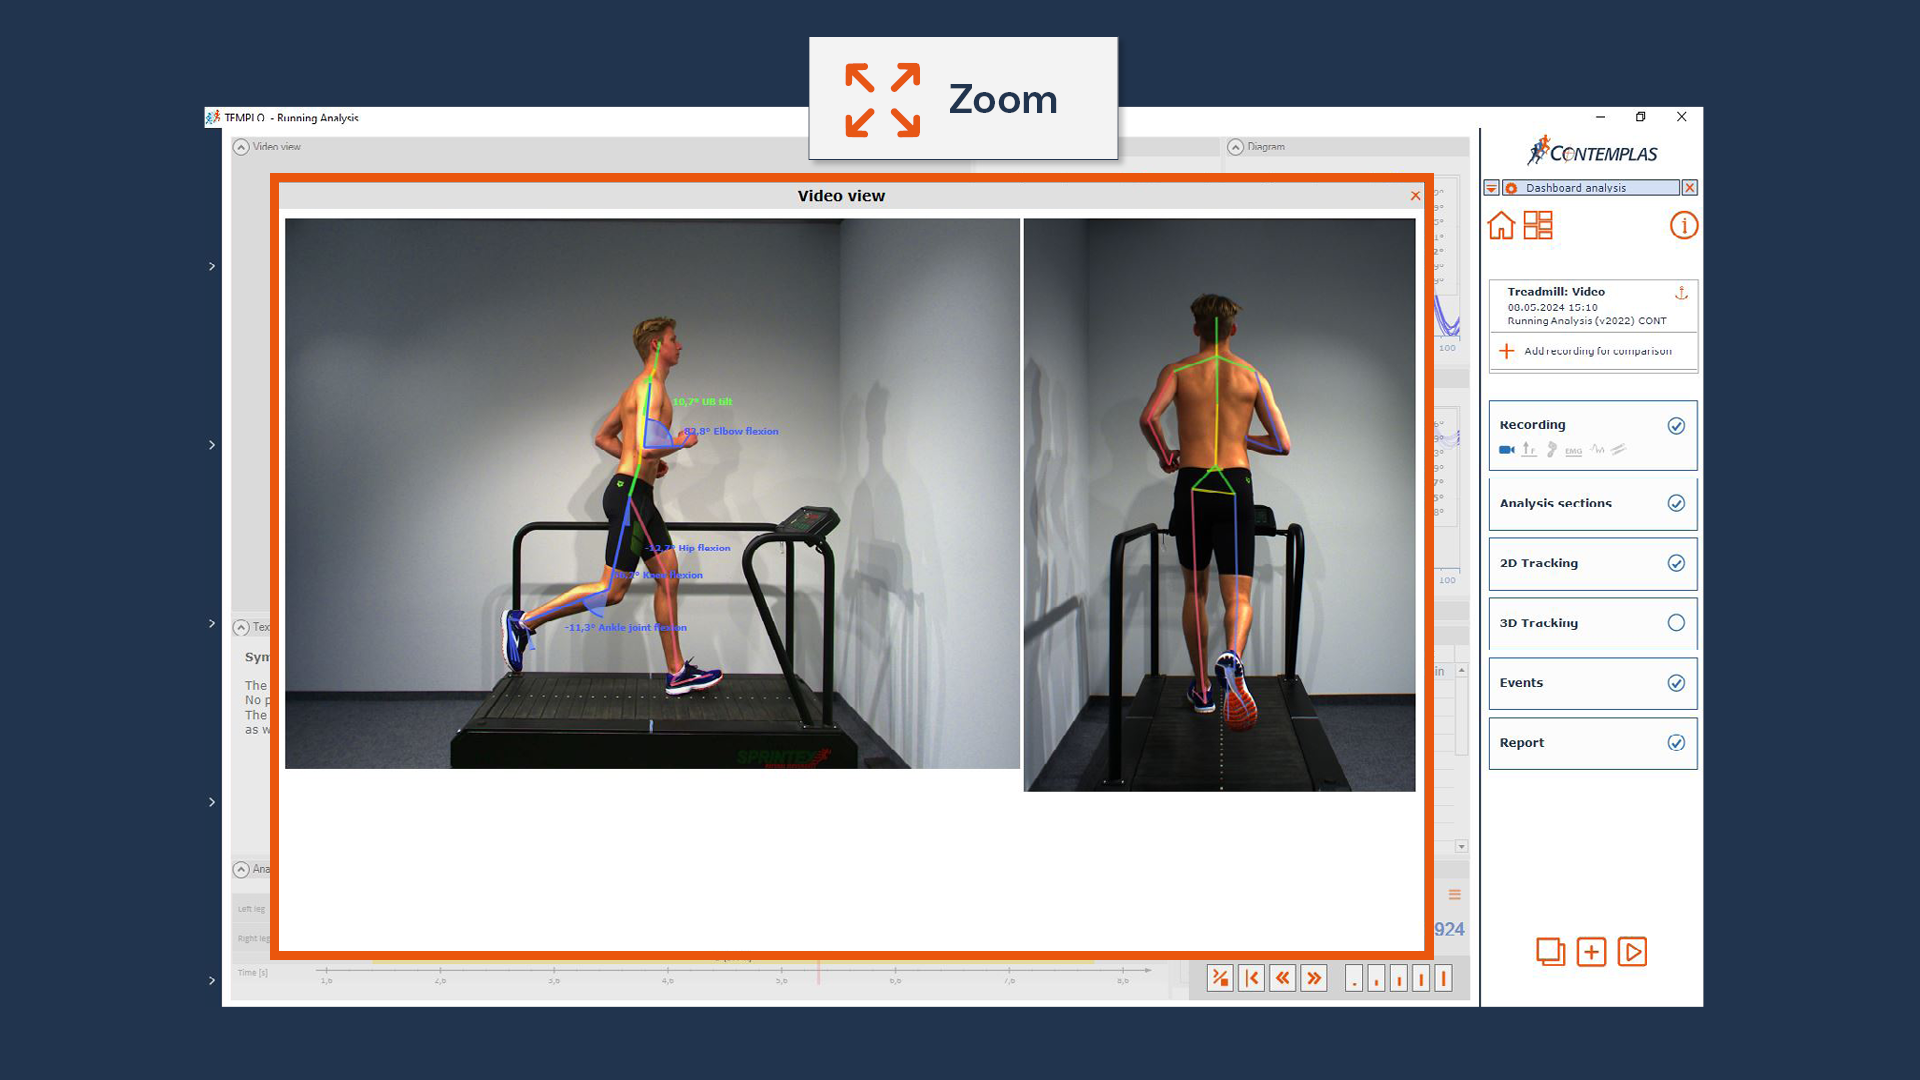
Predefined analysis templates (dashboard) in TEMPLO® allows you to evaluate a recording quickly and easily. The recorded and generated data is automatically displayed. You can also design your own results according to your needs and save them as a template. Display angle and motion path, analog and pressure data and many other data. In addition to the previous angles, other angles have been integrated now, such as: shoulder axis, upper body tilt, ankle joint flexion, pelvis axis and foot axis. During video playback, the selected data and the running phases defined by you in the time line are displayed at the respective time.
Read more
+ Report
With the report function you can individually choose between 3 types of reports. The analysis data entered in the video is retained during export.
– Quick report: The current view of the dashboard can be added to the PDF report collection with one click. Notes and comments can be added to each page.
– Dashboard video export: The analysis is output as a video in the customised dashboard view.
– Video export: The analysis video views are exported to a video.
+ Image enhancement in live image
By integrating various image correction algorithms in TEMPLO®, the following correction measures can be carried out in the live image:
– Brightness correction
– Gamma correction
– Colour normalisation
– Contrast stretching
The parameters set in the camera combination are adopted when the videos are played back. Subsequent (repeated) application of the colour filters is also possible.
+ Optimisation of the pressure distribution
– For successive analyses, the person can remain on the treadmill as there is no need to re-initialise the pressure measurement plate.
– By integrating the pressure distribution measurement on the treadmill, a complete Zebris report with subdivided pressure data can be automatically saved as a PDF after recording video and pressure data in TEMPLO®.
New functions for TEMPLO® Sprintstart Analysis
+ 3D Analysis with Theia3D
Extend your analyses from 2D to 3D by integrating multiple cameras. With Markerless 3D, TEMPLO® allows a straightforward, yet detailed analysis of sprint start. Record your athletes, without the restrictions of traditional systems.
Record – Track – Analyse: Record videos quickly and easily in TEMPLO®. Save valuable time through markerless analysis: no markers, no special clothing, simple setup. The automatic tracking in Theia3D processes the data with a single mouse click. Use the results for extensive, automatic reports in Visual3D, which you can tailor to your individual preference.
Read more
+ Start function
The start signal “On your mark – Set – Go!” can be controlled via the space bar so that the recording can be started with a wireless PC keyboard independently of the measuring station.
+ Expansion of the light barriers
With the expansion from 3 to 5 light barriers, you can now variable set up to 5 intermediate times and use them for evaluation.
New functions for TEMPLO® Performance Analysis
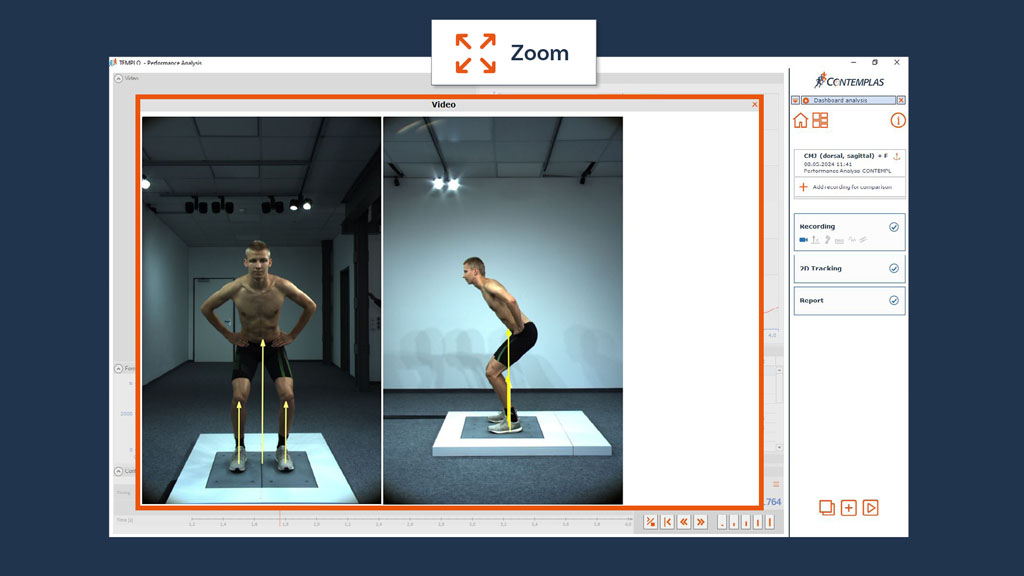
+ Dashboard analysis
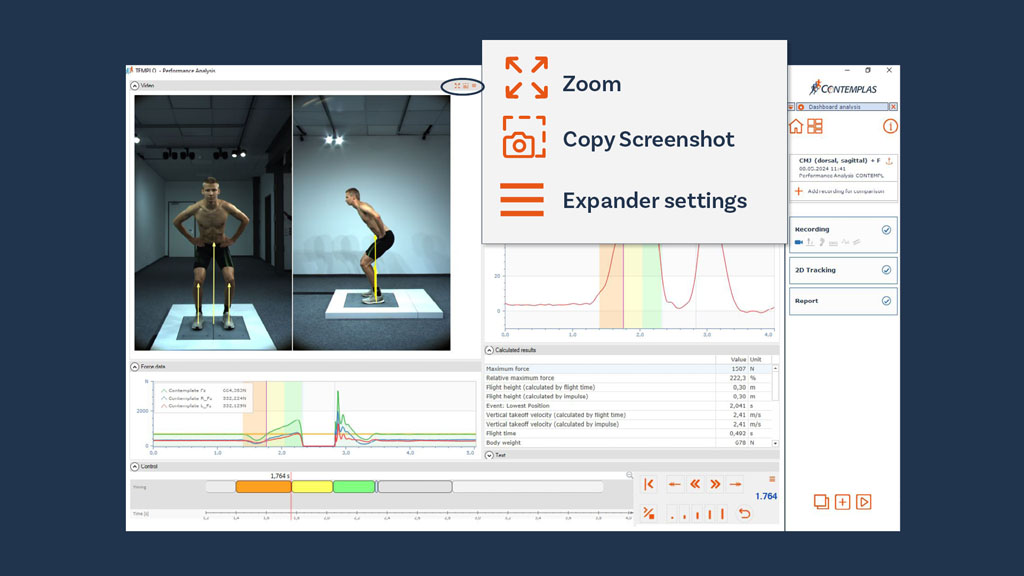
Predefined analysis templates (dashboard) in TEMPLO® allows you to evaluate a recording quickly and easily. The recorded and generated data is automatically displayed. You can also design your own results according to your needs and save them as a template. Display angle and motion path, analog data and many other data. During video playback, the selected data and the events in the Time Line, such as leaving the force plate, landing, contact times, etc., are automatically displayed to you at the respective time.
Read more
+ Report
With the report function you can individually choose between 3 types of reports. The analysis data entered in the video is retained during export.
– Quick report: The current view of the dashboard can be added to the PDF report collection with one click. Notes and comments can be added to each page.
– Dashboard video export: The analysis is output as a video in the customised dashboard view.
– Video export: The analysis video views are exported to a video.
New functions for TEMPLO® FlexiRec
+ Delayed recording and analysis
In the advanced recording view, you can individually define time delays. The video recording can be displayed and recorded on the screen in live or delayed mode. Delayed recording and duplicating the video view on external monitors makes it possible to perform self-analysis or receive direct feedback.
+ Dashboard recording
Start your recordings quickly and easily with our predefined user interface (dashboard). You can also create several personal user interfaces according to your individual requirements and save them as templates. Select the data to be recorded, such as video, analog data, pressure data and EMG. These data are displayed live during the recording.
+ Dashboard analysis
Predefined analysis templates (dashboard) in TEMPLO® allows you to evaluate a recording quickly and easily. The recorded and generated data is automatically displayed. You can also design your own results according to your needs and save them as a template. Display angle and motion path, analog and pressure data and many other data. In addition to the previous angles, other angles have been integrated now, such as: shoulder axis, upper body tilt, ankle joint flexion, pelvis axis and foot axis.
Read more
+ Report
With the report function you can individually choose between 3 types of reports. The analysis data entered in the video is retained during export.
– Quick report: The current view of the dashboard can be added to the PDF report collection with one click. Notes and comments can be added to each page.
– Dashboard video export: The analysis is output as a video in the customised dashboard view.
– Video export: The analysis video views are exported to a video.
+ Image enhancement in live image
By integrating various image correction algorithms in TEMPLO®, the following correction measures can be carried out in the live image:
– Brightness correction
– Gamma correction
– Colour normalisation
– Contrast stretching
The parameters set in the camera combination are adopted when the videos are played back. Subsequent (repeated) application of the colour filters is also possible.
Features TEMPLO® V2020
TEMPLO®
+ User language
– TEMPLO® and various modules have been newly translated, especially the languages Chinese, Italian and Portuguese.
+ Database structure
– The new division of the database into person and session database offers users – recording with team sessions – a faster overview of the database entries.
+ Video Export
The video export function has been updated to allow you to use the following new functions when exporting and sharing TEMPLO® videos:
– Export multiple recording views compressed into one video
– Various compression codecs
– Export of marked analysis tools
– Export of a force vector
+ Feedback App
The additional installation of the new TEMPLO® Feedback App on a mobile device enables the user to play TEMPLO® on several screens simultaneously.
This offers many advantages for the training process:
– Cameras can be set via a mobile device
– With the additional mobile devices several analysis stations are available
– Video images can be send to external recipients in the required streaming format for further processing
+ Delayed recording and analysis
– New pages for single or multi view with setting of the desired time delay.
– Easy recording of the delayed images currently displayed on the screen.
– The number of cameras to be displayed and recorded with a time delay is almost unlimited.
– Integration of external monitors: Display of the live or time-delayed view in full-screen mode.
+ Live mode training
– By minimizing the latency (glass to glass = camera lens to screen), a feedback with mirror character is provided to the athlete. The athlete can train in live mode.
+ 3D still image measurement
– By clicking on two points in an image, a distance can be calculated. If the same point is clicked in two different images, the average speed is calculated. This requires a 3D calibration of the space.
+ Predefined Desktop Buttons
– If you want to start TEMPLO® with a certain scheme and functionality, you can deposit several icons on the desktop, which will open TEMPLO® configured.
+ Image correction
By integrating various image correction algorithms into TEMPLO®, the following corrective measures can be taken:
– Brightness correction
– Gamma correction
– Colour normalisation
– Contrast stretching
The parameters set in the camera combination are applied when playing back the videos. A subsequent (repeated) application of the colour filters is also possible.
+ Feedback training with analog-digital data
– The video-based real-time feedback training can be combined with analog or digital measuring systems, which can be additionally displayed overlaid in the video (e.g. measuring station training).
+ Multi-camera long-term recordings at FullHD and 100Hz
+ Optimizing the display of live and delayed images
– The display of live/delayed images has been optimized to ensure smooth playback at e.g. 30 fps – even with rotated cameras.
+ Software optimization
– Memory leaks:
When using TEMPLO® for a longer period of time with a lot of recordings it could happen that more and more memory was used and the program crashed. This error has now been fixed.
– Playback stability:
Broken or missing AVI files do not affect the playback of the other videos.
+ New system integrations!
– Support of Avanti sensors from Delsys
– Live streaming to DataVolley
TEMPLO® can stream in a format that DataVolley can handle in addition to live viewing or recording. One or more cameras can be output in the streaming format required by DataVolley.
– Recording with 10 GigE cameras
Various 10-GigE cameras were integrated, which can, for example, record 8MP at 95 frames per second.
– Synchronisation of different measuring systems with TEMPLO® by sending trigger events
During video recording TEMPLO® can send electrical trigger signals via an A/D converter to an external device which records these signals for its own purposes.
– Zebris: Import PDF Report
The interface to Zebris pressure measurement systems was extended so that after recording video and print data in TEMPLO®, a Zebris report was automatically imported as a PDF by the Zebris software.
New functions for TEMPLO® Sprintstart Analysis
+ OptoJump Integration
The OptoJump system can be used in combination with our 3D sprint start block:
– Automatic, synchronous start and recording of OptoJump data with the video cameras
> Comparison of initial forces (block forces) and ground reaction forces of the first steps
– Automatic definition of the first step (left or right)
– Extension of the integration from 2 to 3 light barriers. Variable definition of up to 3 split times
+ Scheme upgrade up to 4 camera views
New functions for TEMPLO® Performance Analysis
+ Balance: Display 2D Diagram
– As a live feedback system for active training and to show one-sided loads when lifting, standing or knee bending, the display of the Center of Pressure (COP) for balance tests has been improved. These tests can also be performed in a one-legged position.
+ Jump: One leg jump on CTP DUAL FORCE PLATE®
– Moreover, all common jumps (CMJ, SJ, DJ) are available as one-legged jump now. The evaluations were extended accordingly.
+ Balance: Balance measurement using Center of Pressure (COP)
– With the help of the deviation from the center of gravity of the body, the ability to balance can be displayed numerically and graphically. A left-right comparison is possible.
New functions for TEMPLO® Swimming Performance Analysis
+ Predefined desktop buttons for feedback training (coaching)
– Desktop buttons can be easily defined and created with preset camera combinations in live or delay mode for fast and flexible operations in feedback mode.
+ New calibration
– Predefined workflow guides the user to calibrate the surface and underwater cameras
– The calibration can be performed within 10 minutes.
+ Image correction
By integrating various image correction algorithms into TEMPLO®, the following corrective measures can be taken:
– Brightness correction
– Gamma correction
– Colour normalisation
– Contrast stretching
The parameters set in the camera combination are applied when playing back the videos. A subsequent (repeated) application of the color filters is also possible.
+ Video Export in swimming
-Export multiple recording views compressed into one video
– Various compression codecs
– Export of marked analysis tools
+ TEMPLO® TWIN CAM TROLLEY MODULE
– New and enhanced recording view of the vertically stitched cameras
– Optimization of the display speed so that the swimmer can be followed over the video image
– Video export with both views
+ TEMPLO® RACE ANALYSIS
– Entry of competition times: Split times, which are provided as race data, can now be entered in TEMPLO® and automatically set as events
– Manual selection of parameters: Timing parameters can now be selected according to interest. There is no longer need to click on superfluous parameters. In the EXECEL export all split times that have been clicked are still available.
– New parameters for turn analysis: In addition to 5 in / 15 out, there are now further parameters for the evaluation of turns: 5 in/5 out and 5 in/10 out
+ TEMPLO® START & TURN ANALYSIS
– Skip events: In the event definition, non-relevant events can now simply be skipped.
New functions for TEMPLO® Ergonomics
In addition to the proven OEM version HUMEN, the in-house product TEMPLO® Ergonomics is now available with the same functionality. In this way, the way was opened for sales on the international market.
+ Preview function of imported images
– Imported images are displayed in advance.
+ Fast and easy image rotation for subsequent analysis
– Images can be rotated more quickly and easily for subsequent analysis, depending on the exposure (vertical or horizontal).
+ Clear report design
+ English version
– From now on english is available as user language in the program.
+ Software optimisation
– Malfunction “double click in the analysis view” removed
– Company records can now be completely deleted